Self experimenting for burn out and fatigue using resting heart rate.
For the last few weeks I’ve been performing orthostatic heart rate analysis to help detect when my body was in a state of fatigue from training too frequently.
I have found that I’m prone to hit the gym too much or not sleep enough. For some reason my body seems fine until I hit a wall.
Once I hit the wall I can have a BIG set back requiring significant sleep (>10
hours) and sometimes 1-2 days where I have to rest.
It also has a big impact psychologically as I want to control my fate and plan out my daily routine.
Yesterday was a burn out day. Just completely fatigued. Couldn’t complete my workout and this was also accompanied by cravings which meant I broke my diet.
To perform this analysis is easy.
Basically, you wake up, put on a heartrate monitor and then record your heart rate for 3 minutes. Then you stand up and measure the difference 15 seconds after you stand.
The difference between your peak and your mean is called your orthostatic measurement.
However, I’ve found that this isn’t valuable. It’s always the same.
What IS valuable is the mean resting heart rate. This does seem to vary.
I trim off the first minute of data, then take the 120 values from the 2nd and 3rd minute, and compute the mean.
This value DID tend to be higher on days where I trained the day before.
However, ONLY when I had lower blood pressure.
Part of this process identified that I have Postural Orthostatic Tachycardio Syndrome. Either that or I’m just very salt sensitive.
Either way it’s not an issues. If I have low blood pressure I just take in a bit of salt (1-2g) and 30-60 minutes later my blood pressure is higher. I can then maintain this over 3-4 days until I require some more salt.
I discarded the previous week of measurement data and started again.
However, when I ran the second set, other than an initial peak, the values were somewhat stable with a lower standard deviation.
If you ignore the fist peak (ignoring data in a scientific experiement isn’t always a good idea and can yield to cherry picking and confirmation bias), which I can’t really explain due to the following data, the standard deviation is lower and my trend is somewhat stable.
The stdev for the first series is 3.8 vs 2.2 for the second series.
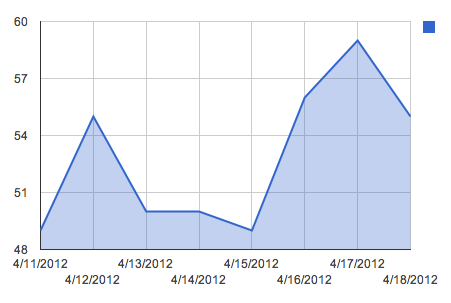
First series showing more variability.
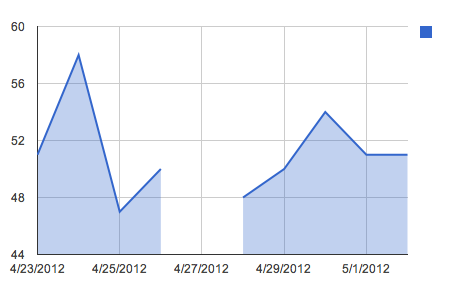
Second series showing less variability.
The main problem is that the most recent measurement did NOT predict that I was fatigued and that I would have a bad training day.
The first set of data did seem to correlate well with whether I had trained the day before.
But yesterday was a BAD burn out day and this analysis didn’t predict anything.
Conclusions
I’m not sure I have any had conclusions from this experiment just yet.
My thinking is that perhaps this analysis is indicative of the problem but not a strong predictor. If the heart rate just tends to be higher then one day where it was normal isn’t unusual.
I may have to use this metric along with another of other metrics to determine when to train or not.
The only problem is, that I didn’t have muscle soreness, lethargy, or any other symptoms until I got on my bike and was half way into my training session for the day.
Perhaps the only REAL way to solve this is to just build in FORCED rest days where even if I COULD train I force myself to rest anyway.
This would yield some inefficiency but would prevent burn out.
Flickr


